


Table of contents
Setting Up
---
config:
  theme: neutral
  layout: elk
---
graph TD
    download[Download the docker compose file] --> run(Spin up the container)
    run --> web{Visit localhost:9949}
    web --> raw[Raw data]
    web --> report[EDA report]
    web --> outlier[Outliers detected]
Workflow
---
config:
  theme: neutral
  layout: elk
---
graph LR
    input[Biometrics] --> upload(Upload data)
    subgraph bqat [BQAT Web GUI]
      upload --> process[Process biometric samples]
      process --> preview[Preview raw output]
    end
    preview --> raw(Download raw output as CSV)
    preview --> outlier(Identify potential outliers)
    preview --> report(Genrate EDA report from the data)
BQAT-GUI could also distrubuted as a desktop application, reach out to us for further detail.
User Interface
Home
This is the landing page, with a brief introduction to the BQAT workflow.
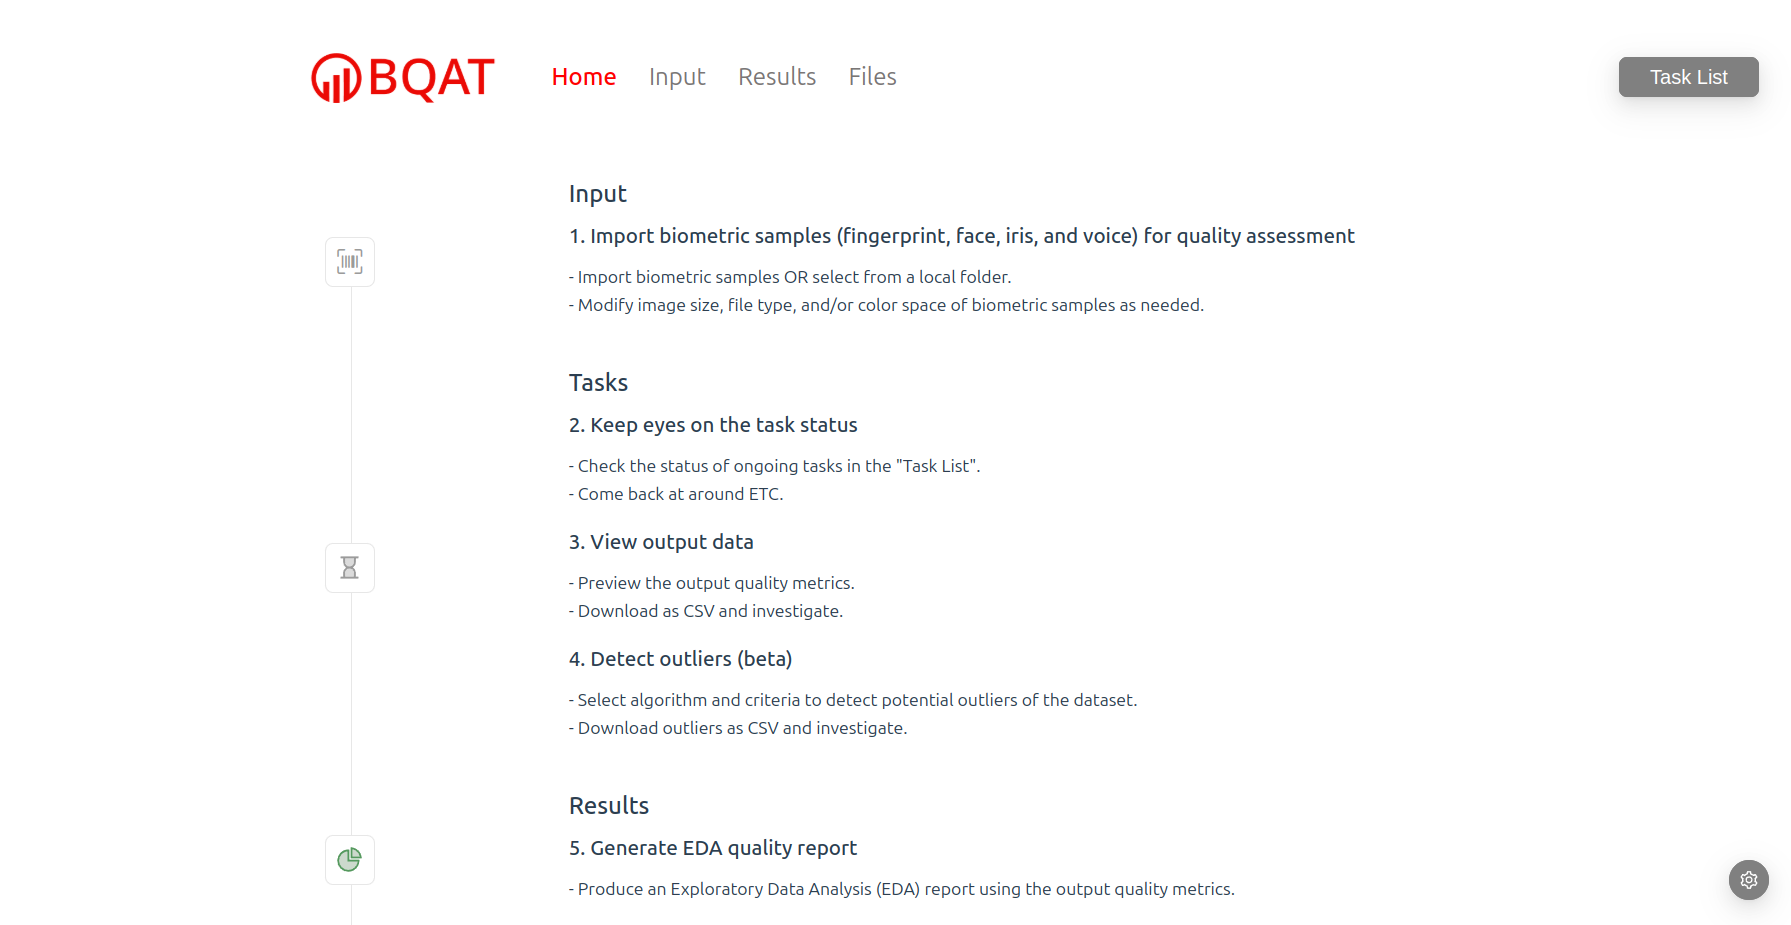
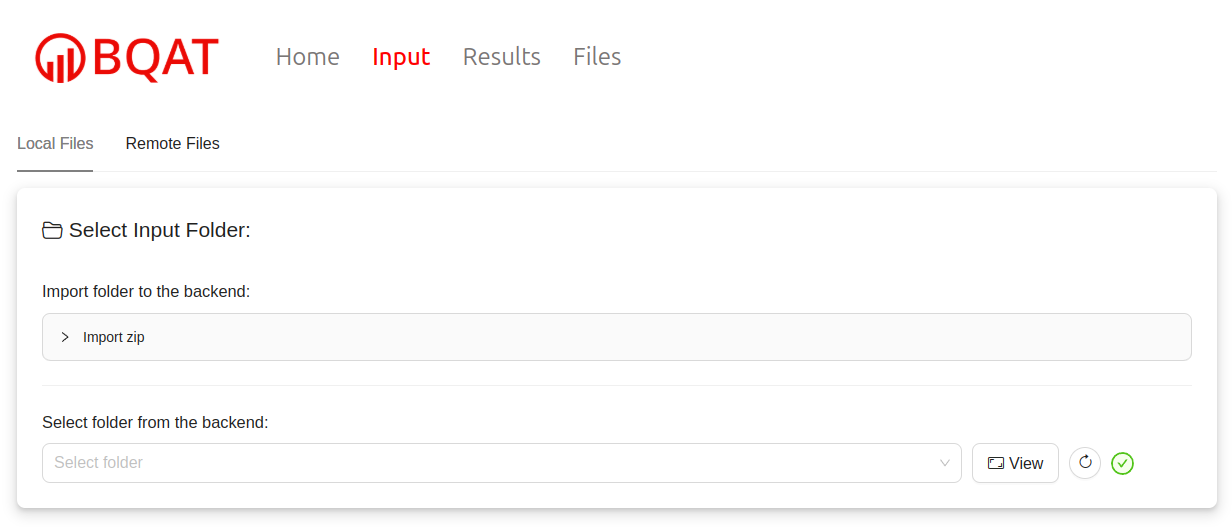
Data Input
Import/select input data and submit analysis task.
-
Local files
-
The user could import dataset as zip file to the server.
-
Or may transfer the data to the data folder on the machine (if you run it on your local machine or have access to the machine).
-
-
Remote files
- The user could also upload files from the browser directely (limited number possible), and the data won’t be saved on the server once processed.
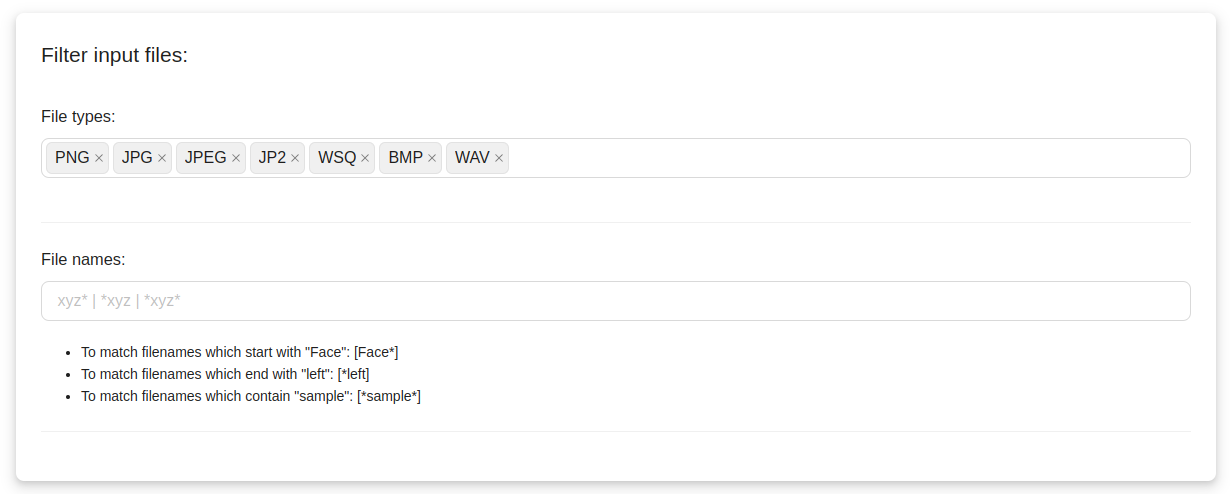
You may filter the input files by filename or type.
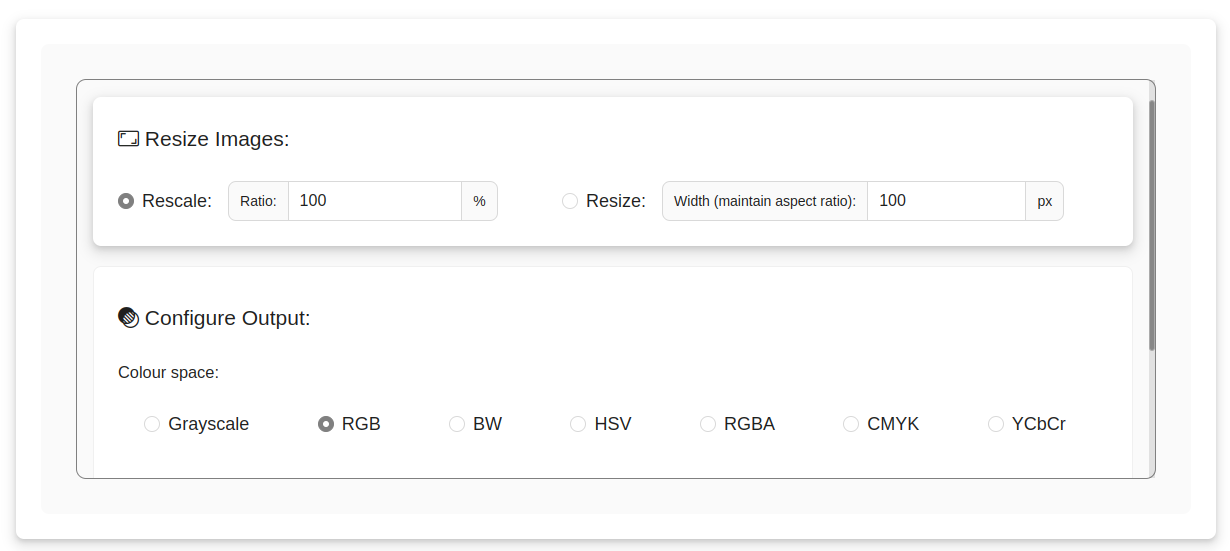
You may convert/rescale the input files if needed.
Select dataset modality and processing engine(s).

Task Management
Monitor status of ongoing task. You can stop/resume or cancel the task.
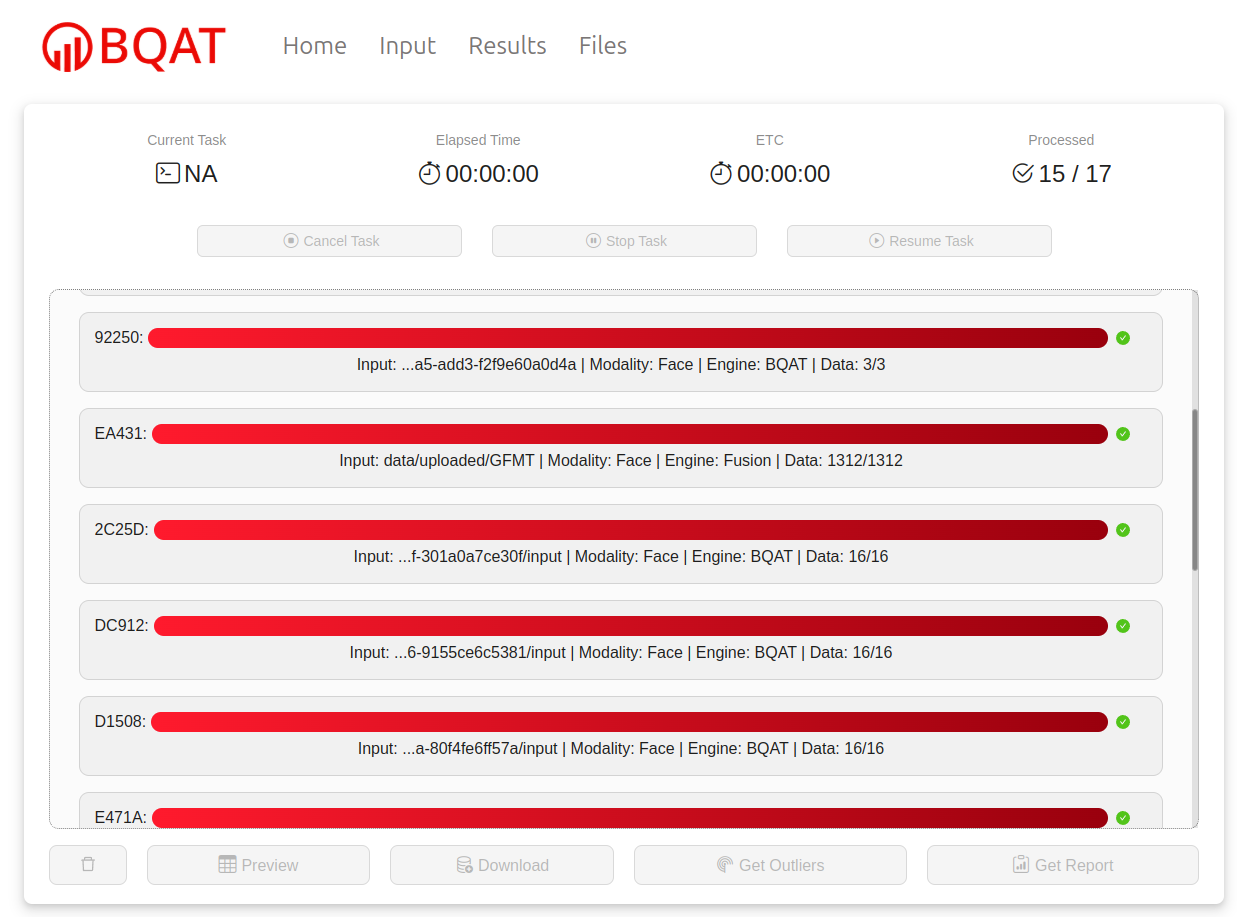
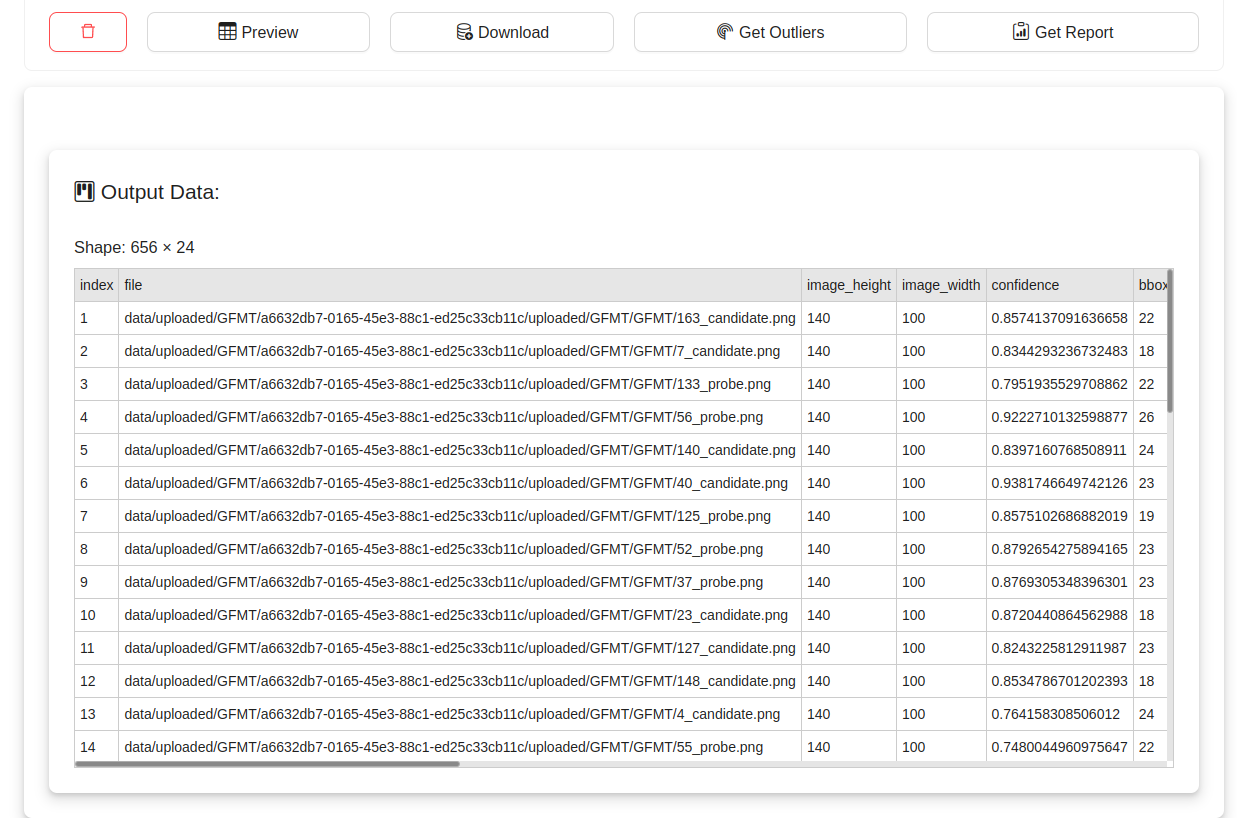
Preview/download output data.
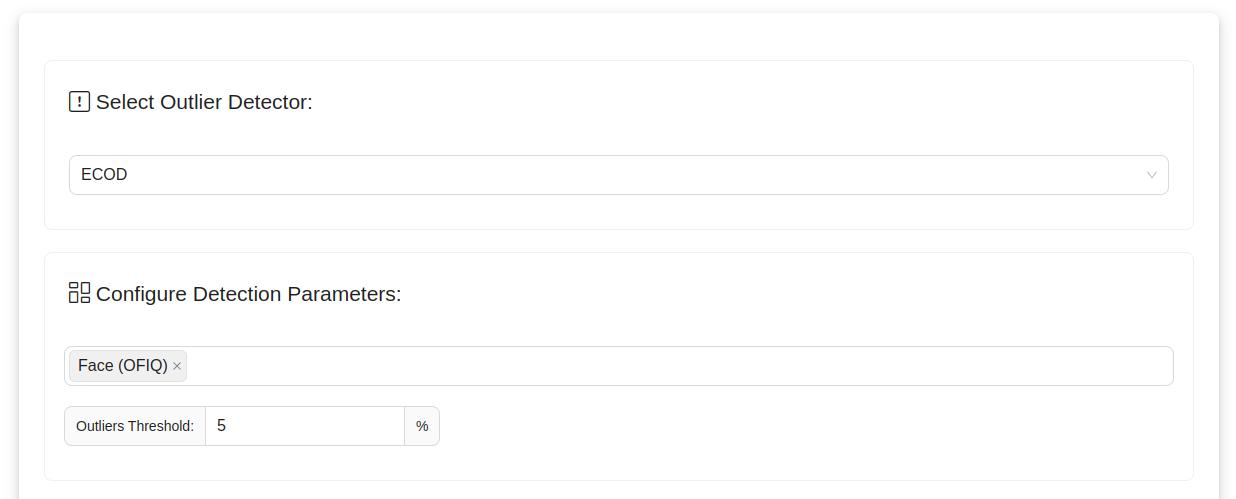
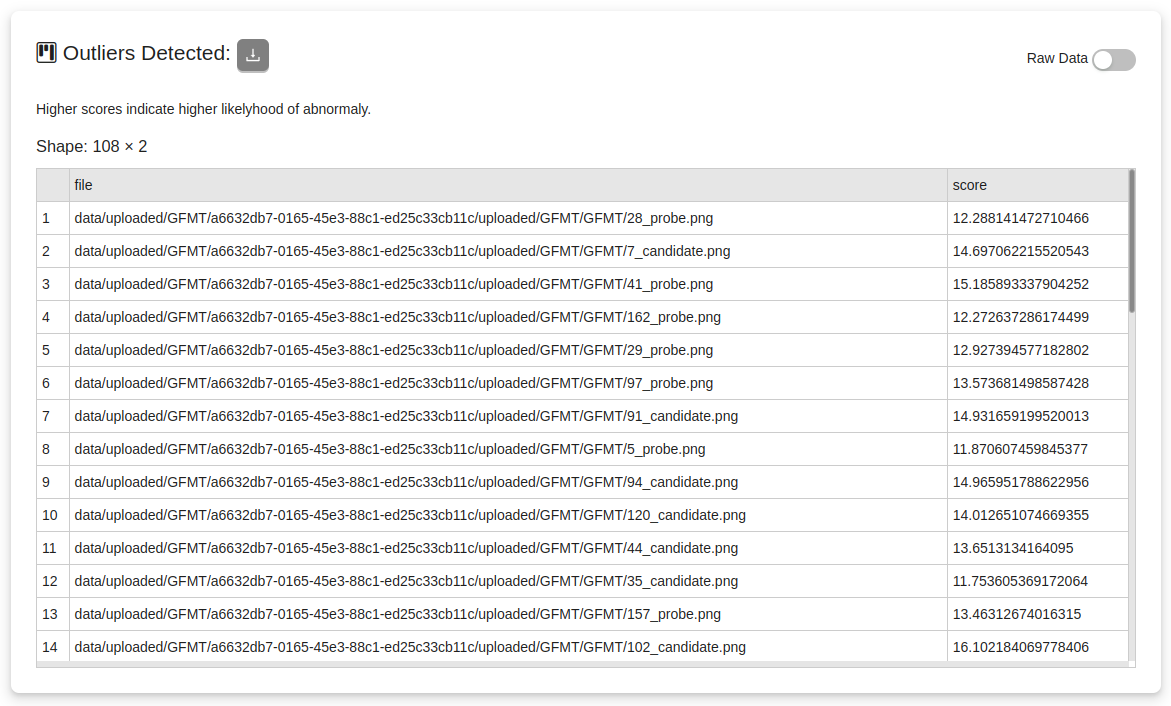
Identify potential outliers using output data.
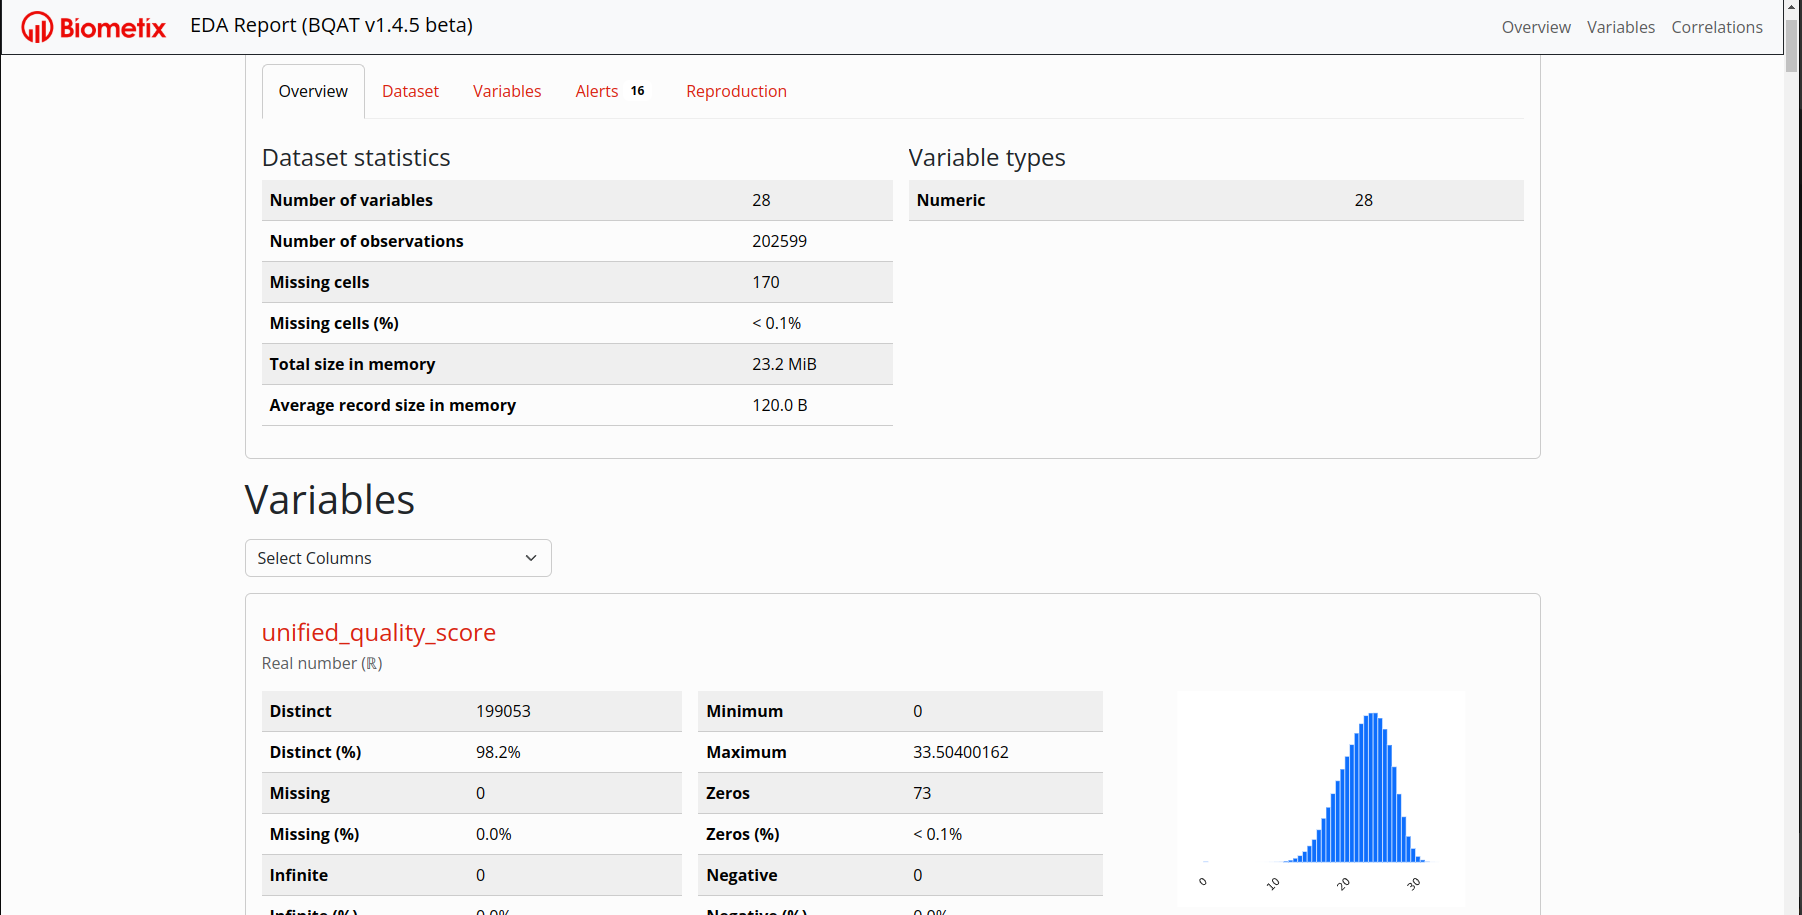
Generate EDA report using output data.

Analysis Results
You may view/download the EDA report in this page. You can also share the report via the QR code.
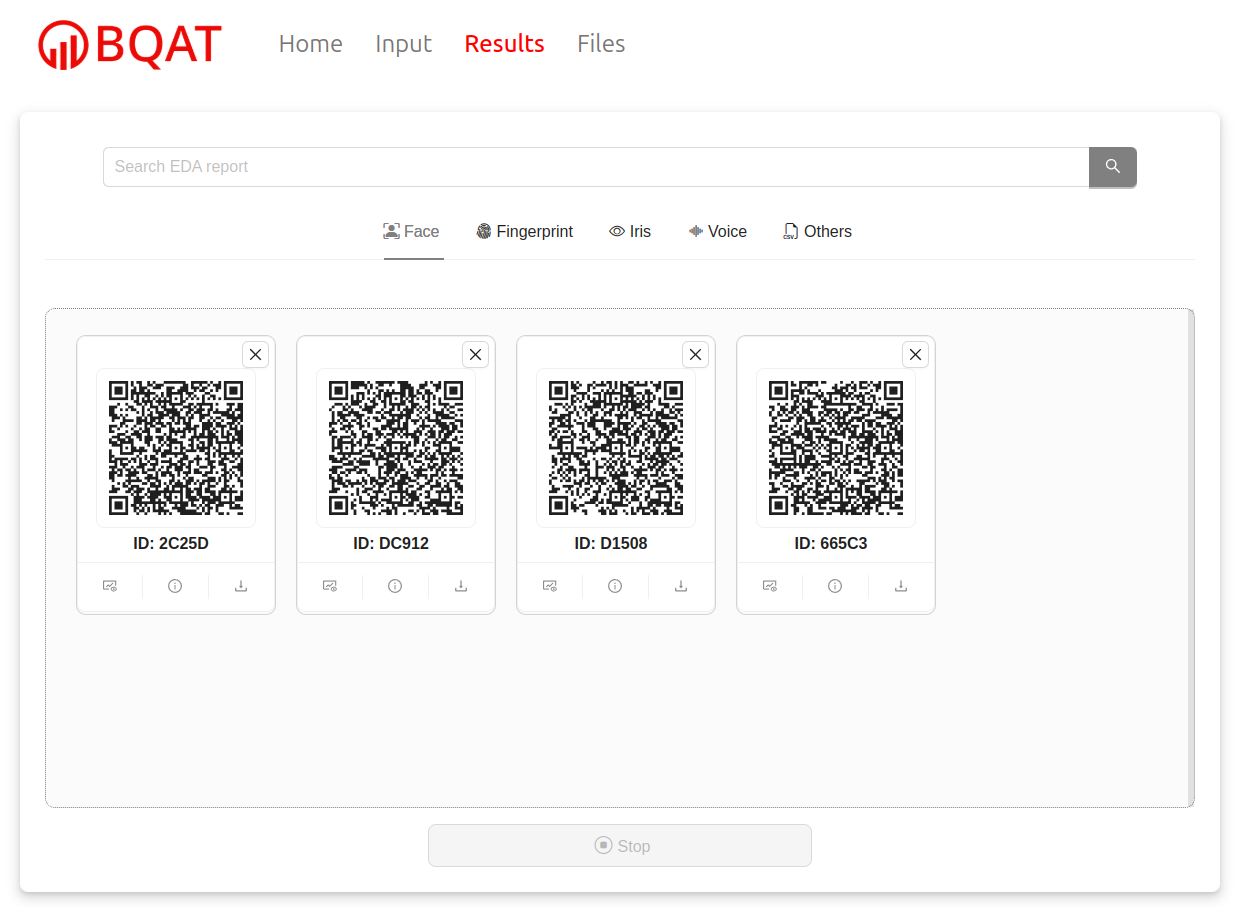
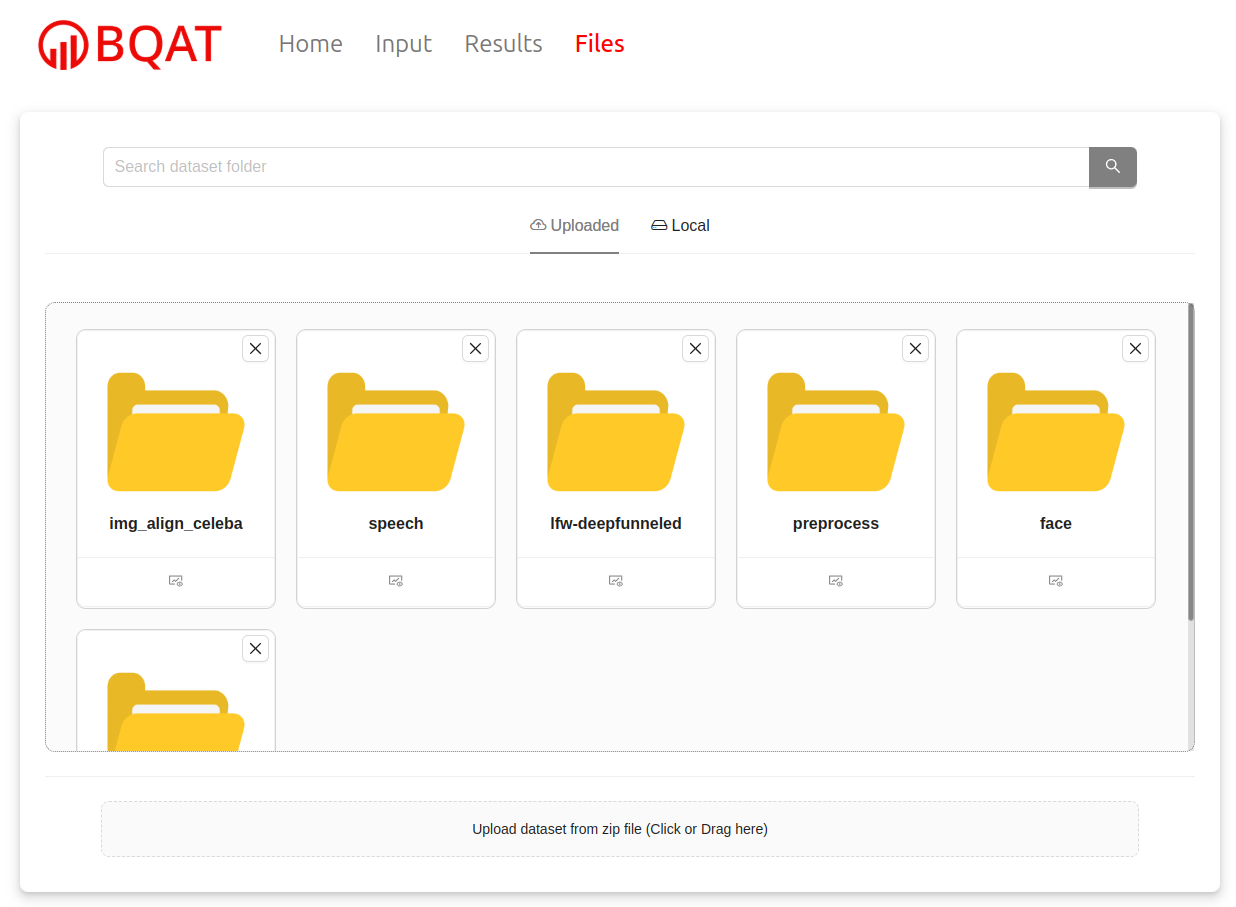
Data Management
Instead of import/upload the dataset from input tab, you may upload the dataset via this tab beforehand (and delete if you like).
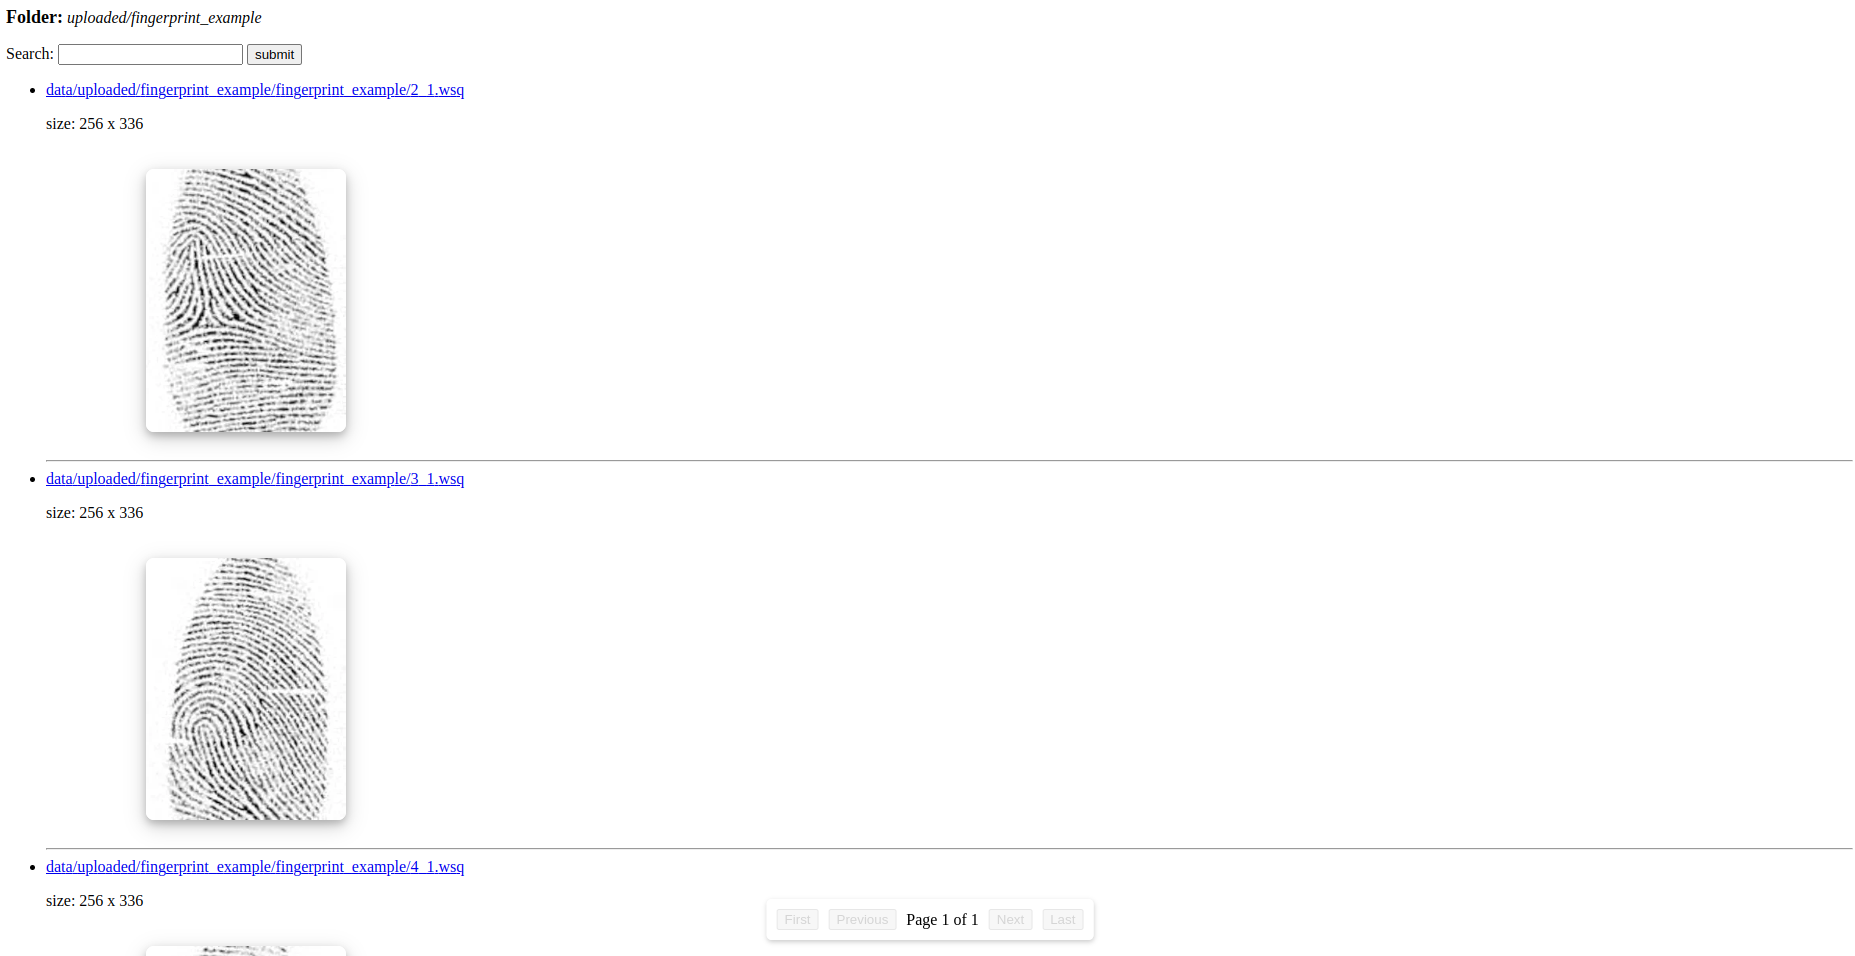
You can inspect the data as well (WSQ fingerprint files supported).
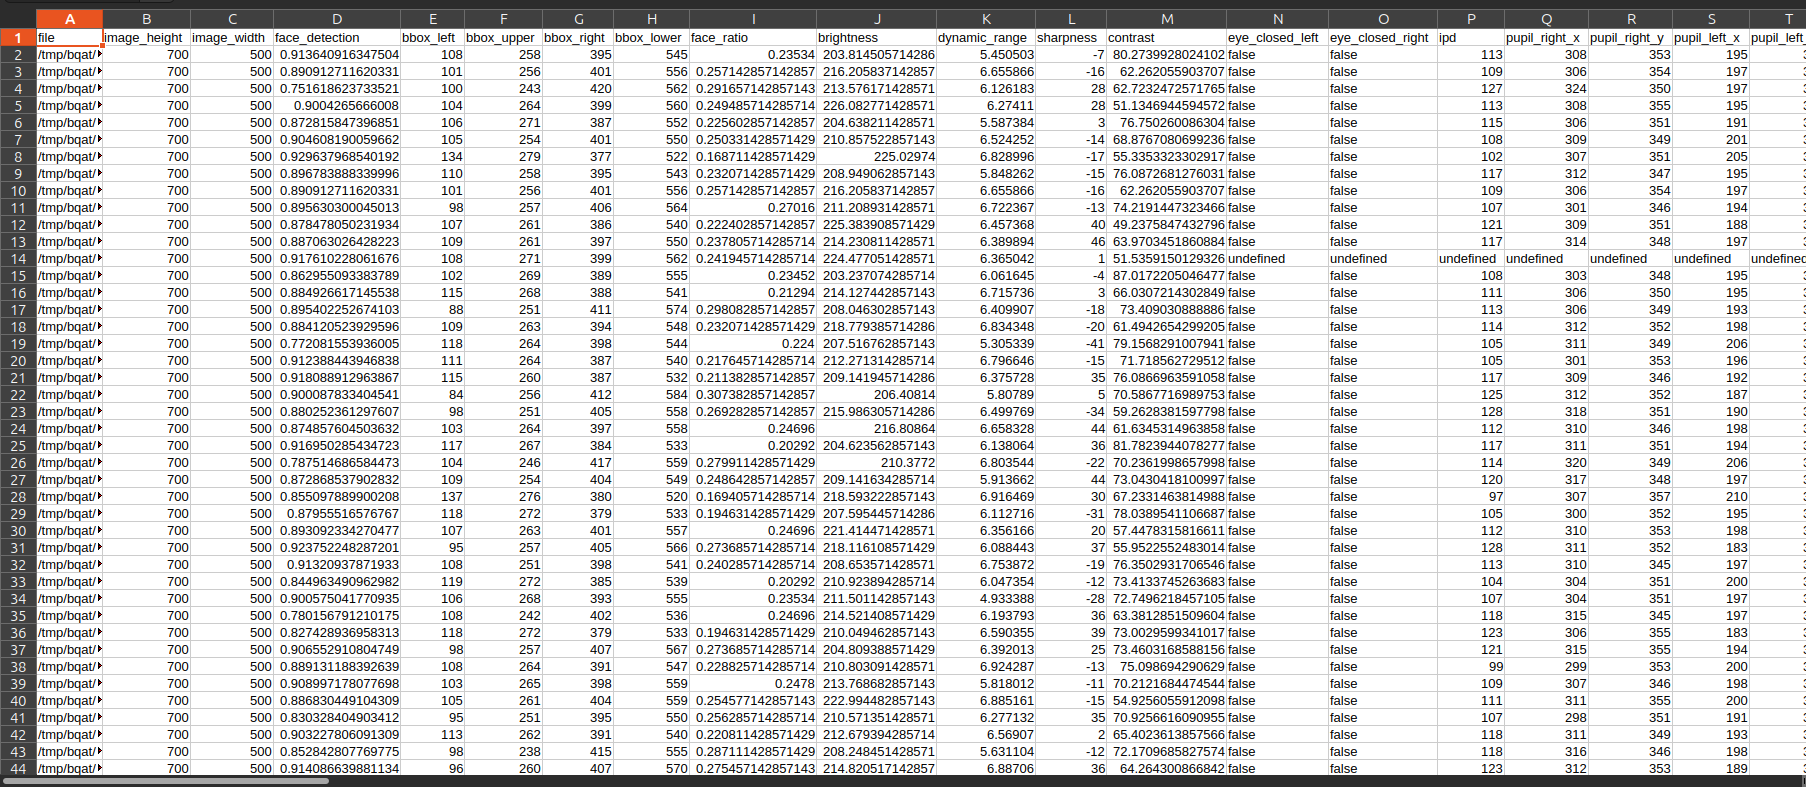
Output
Raw Data
EDA Report
Outlier Detection
BQAT-GUI lite
This version is a simple example web interface, which expose only the main biometic processing function.
Note: Not suitable for large dataset processing due to browser limitation.
Setting Up
---
config:
  theme: neutral
  layout: elk
---
graph TD
    download[Download the docker compose file] --> run(Spin up the container)
    run --> web{Visit localhost:7860}
    web --> output[Output exported as CSV]
Workflow
---
config:
  theme: neutral
  layout: elk
---
graph LR
    input[Biometrics] --> submit(Submit task)
    subgraph BQAT Web GUI
    submit --> check[Check task status]
    check --> retrieve(Retrieve raw output when finished)
    end
    retrieve --> export(Download output as CSV)
User Interface
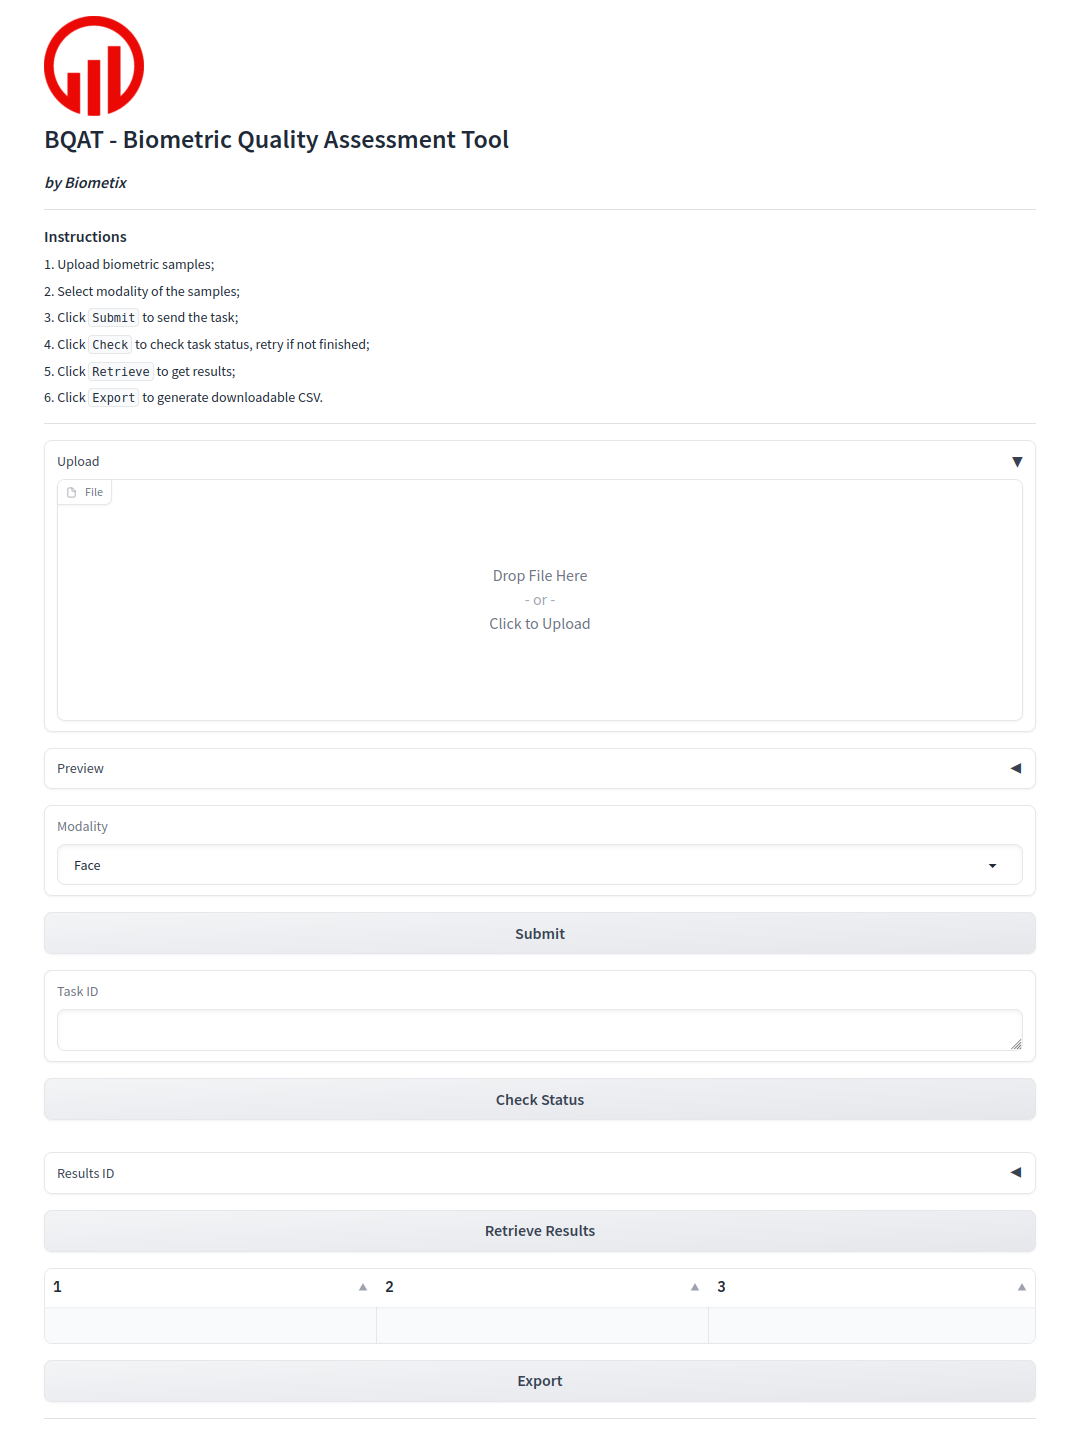
Output
The output can be downloaded as CSV.

